UbiOps
UbiOps is a machine learning operations platform that simplifies the deployment and management of machine learning (ML) models. Users can easily orchestrate and run AI workloads locally, in a hybrid cloud or across multiple clouds using the intuitive webapp.
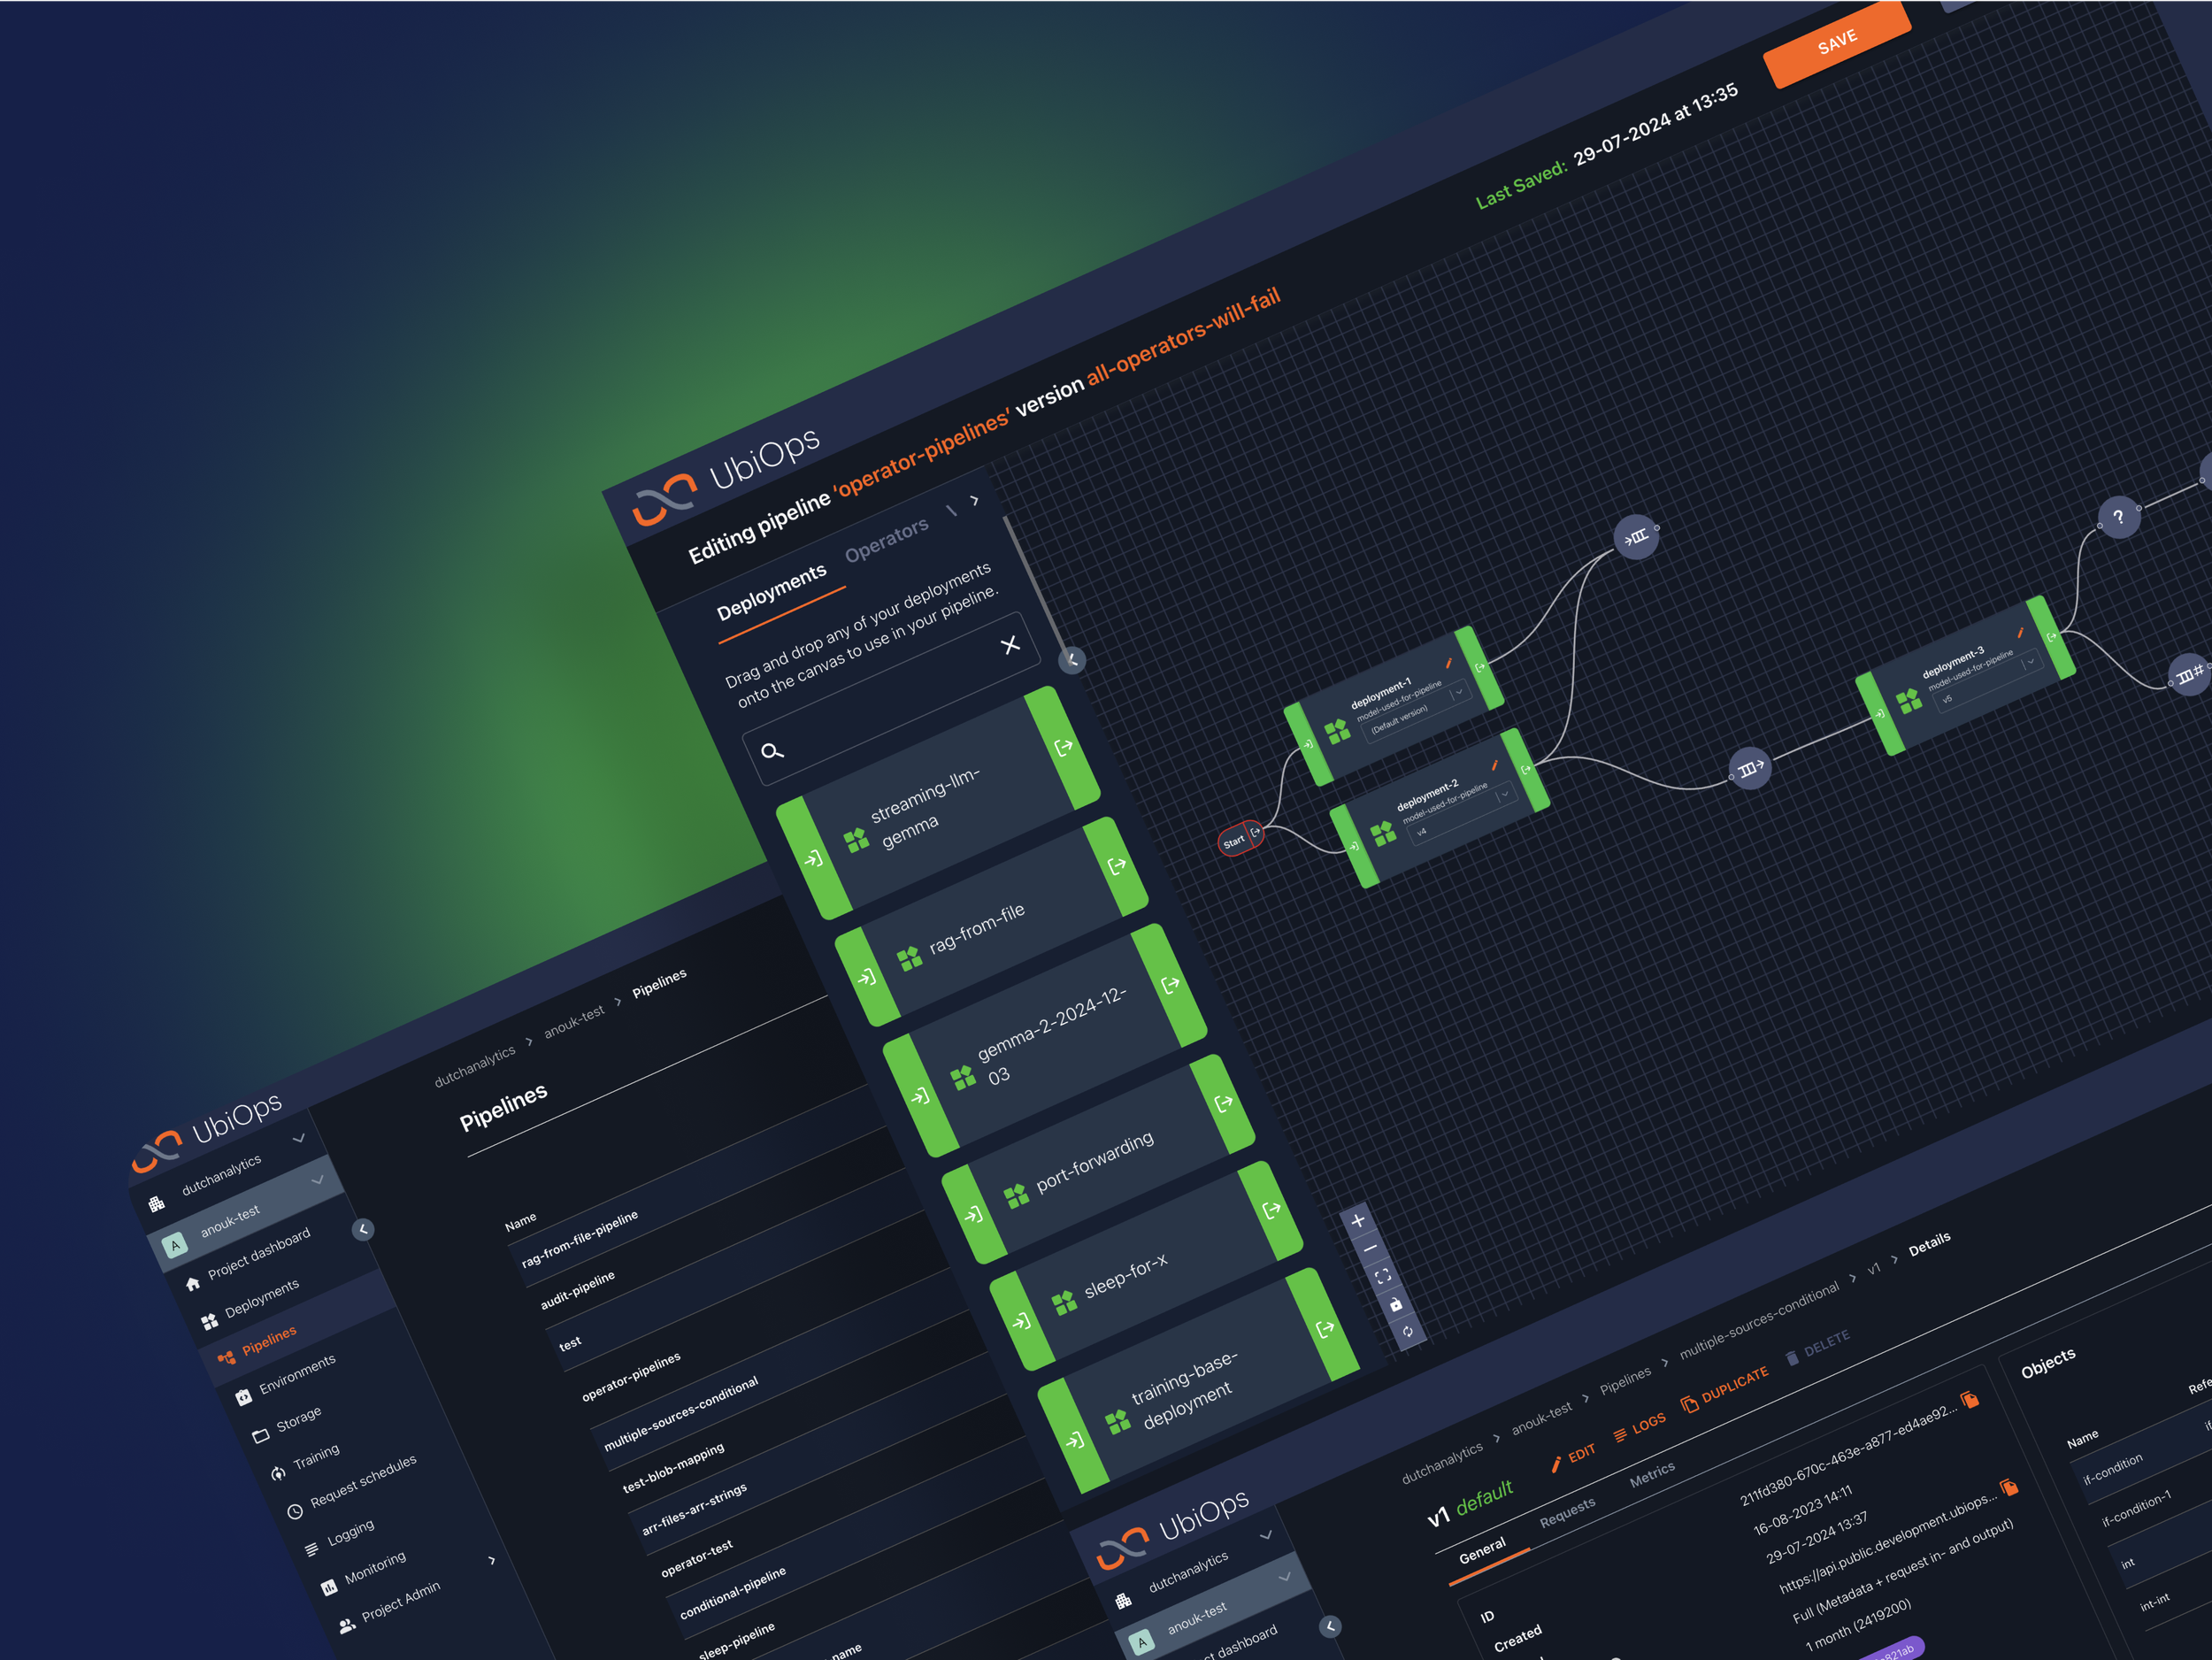
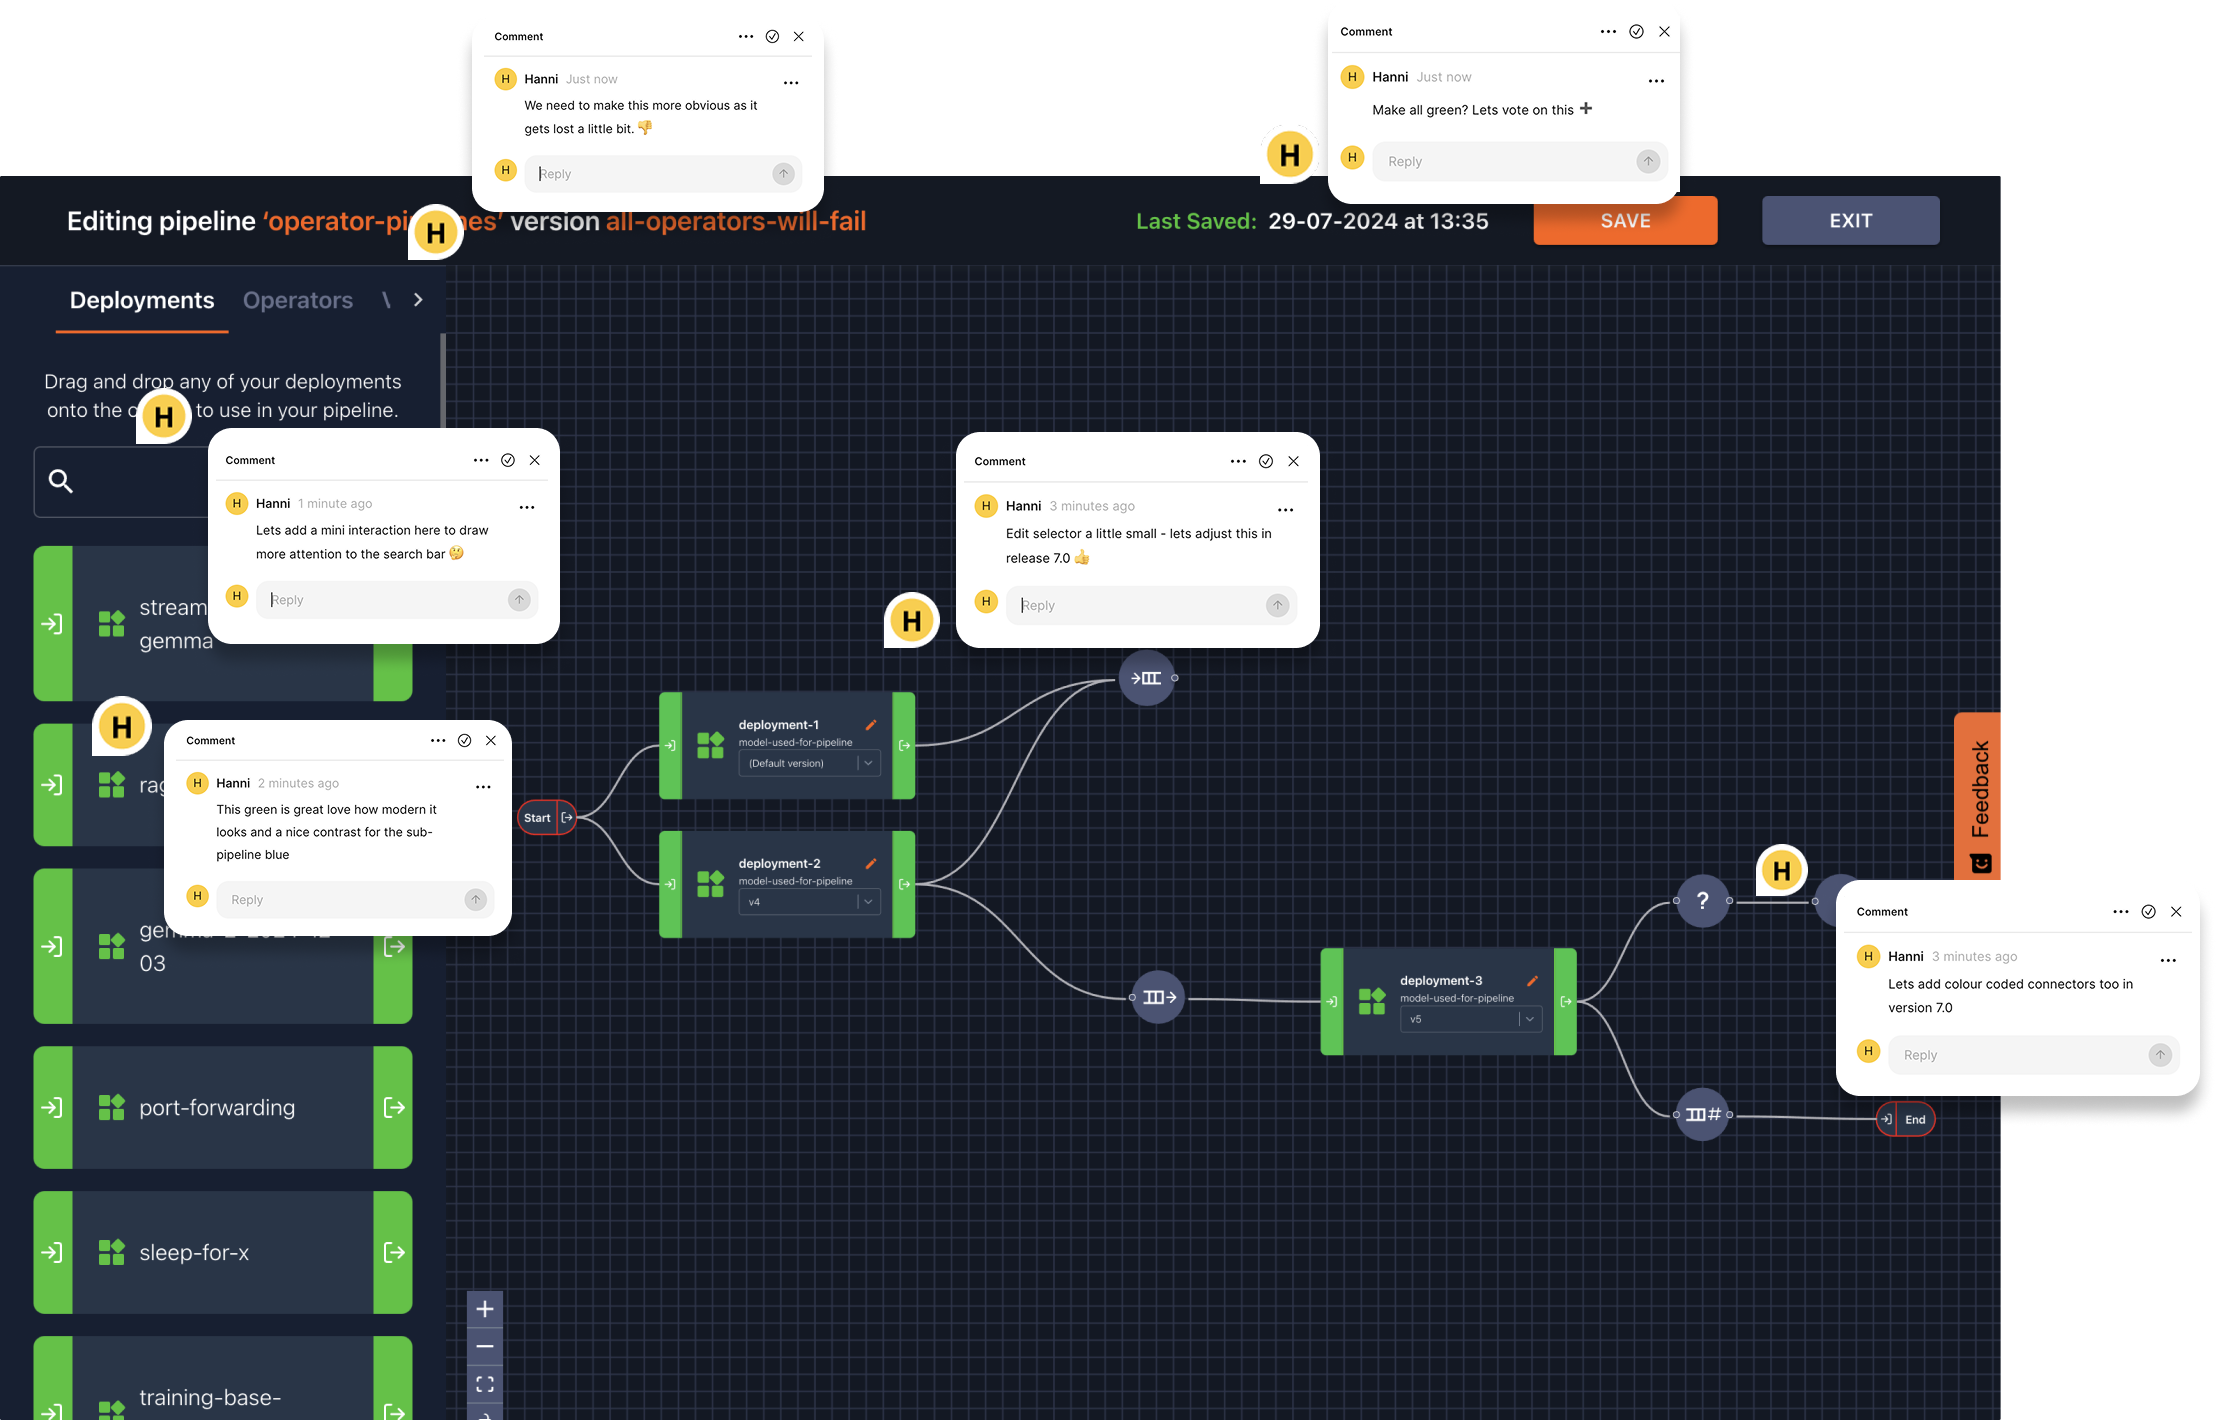
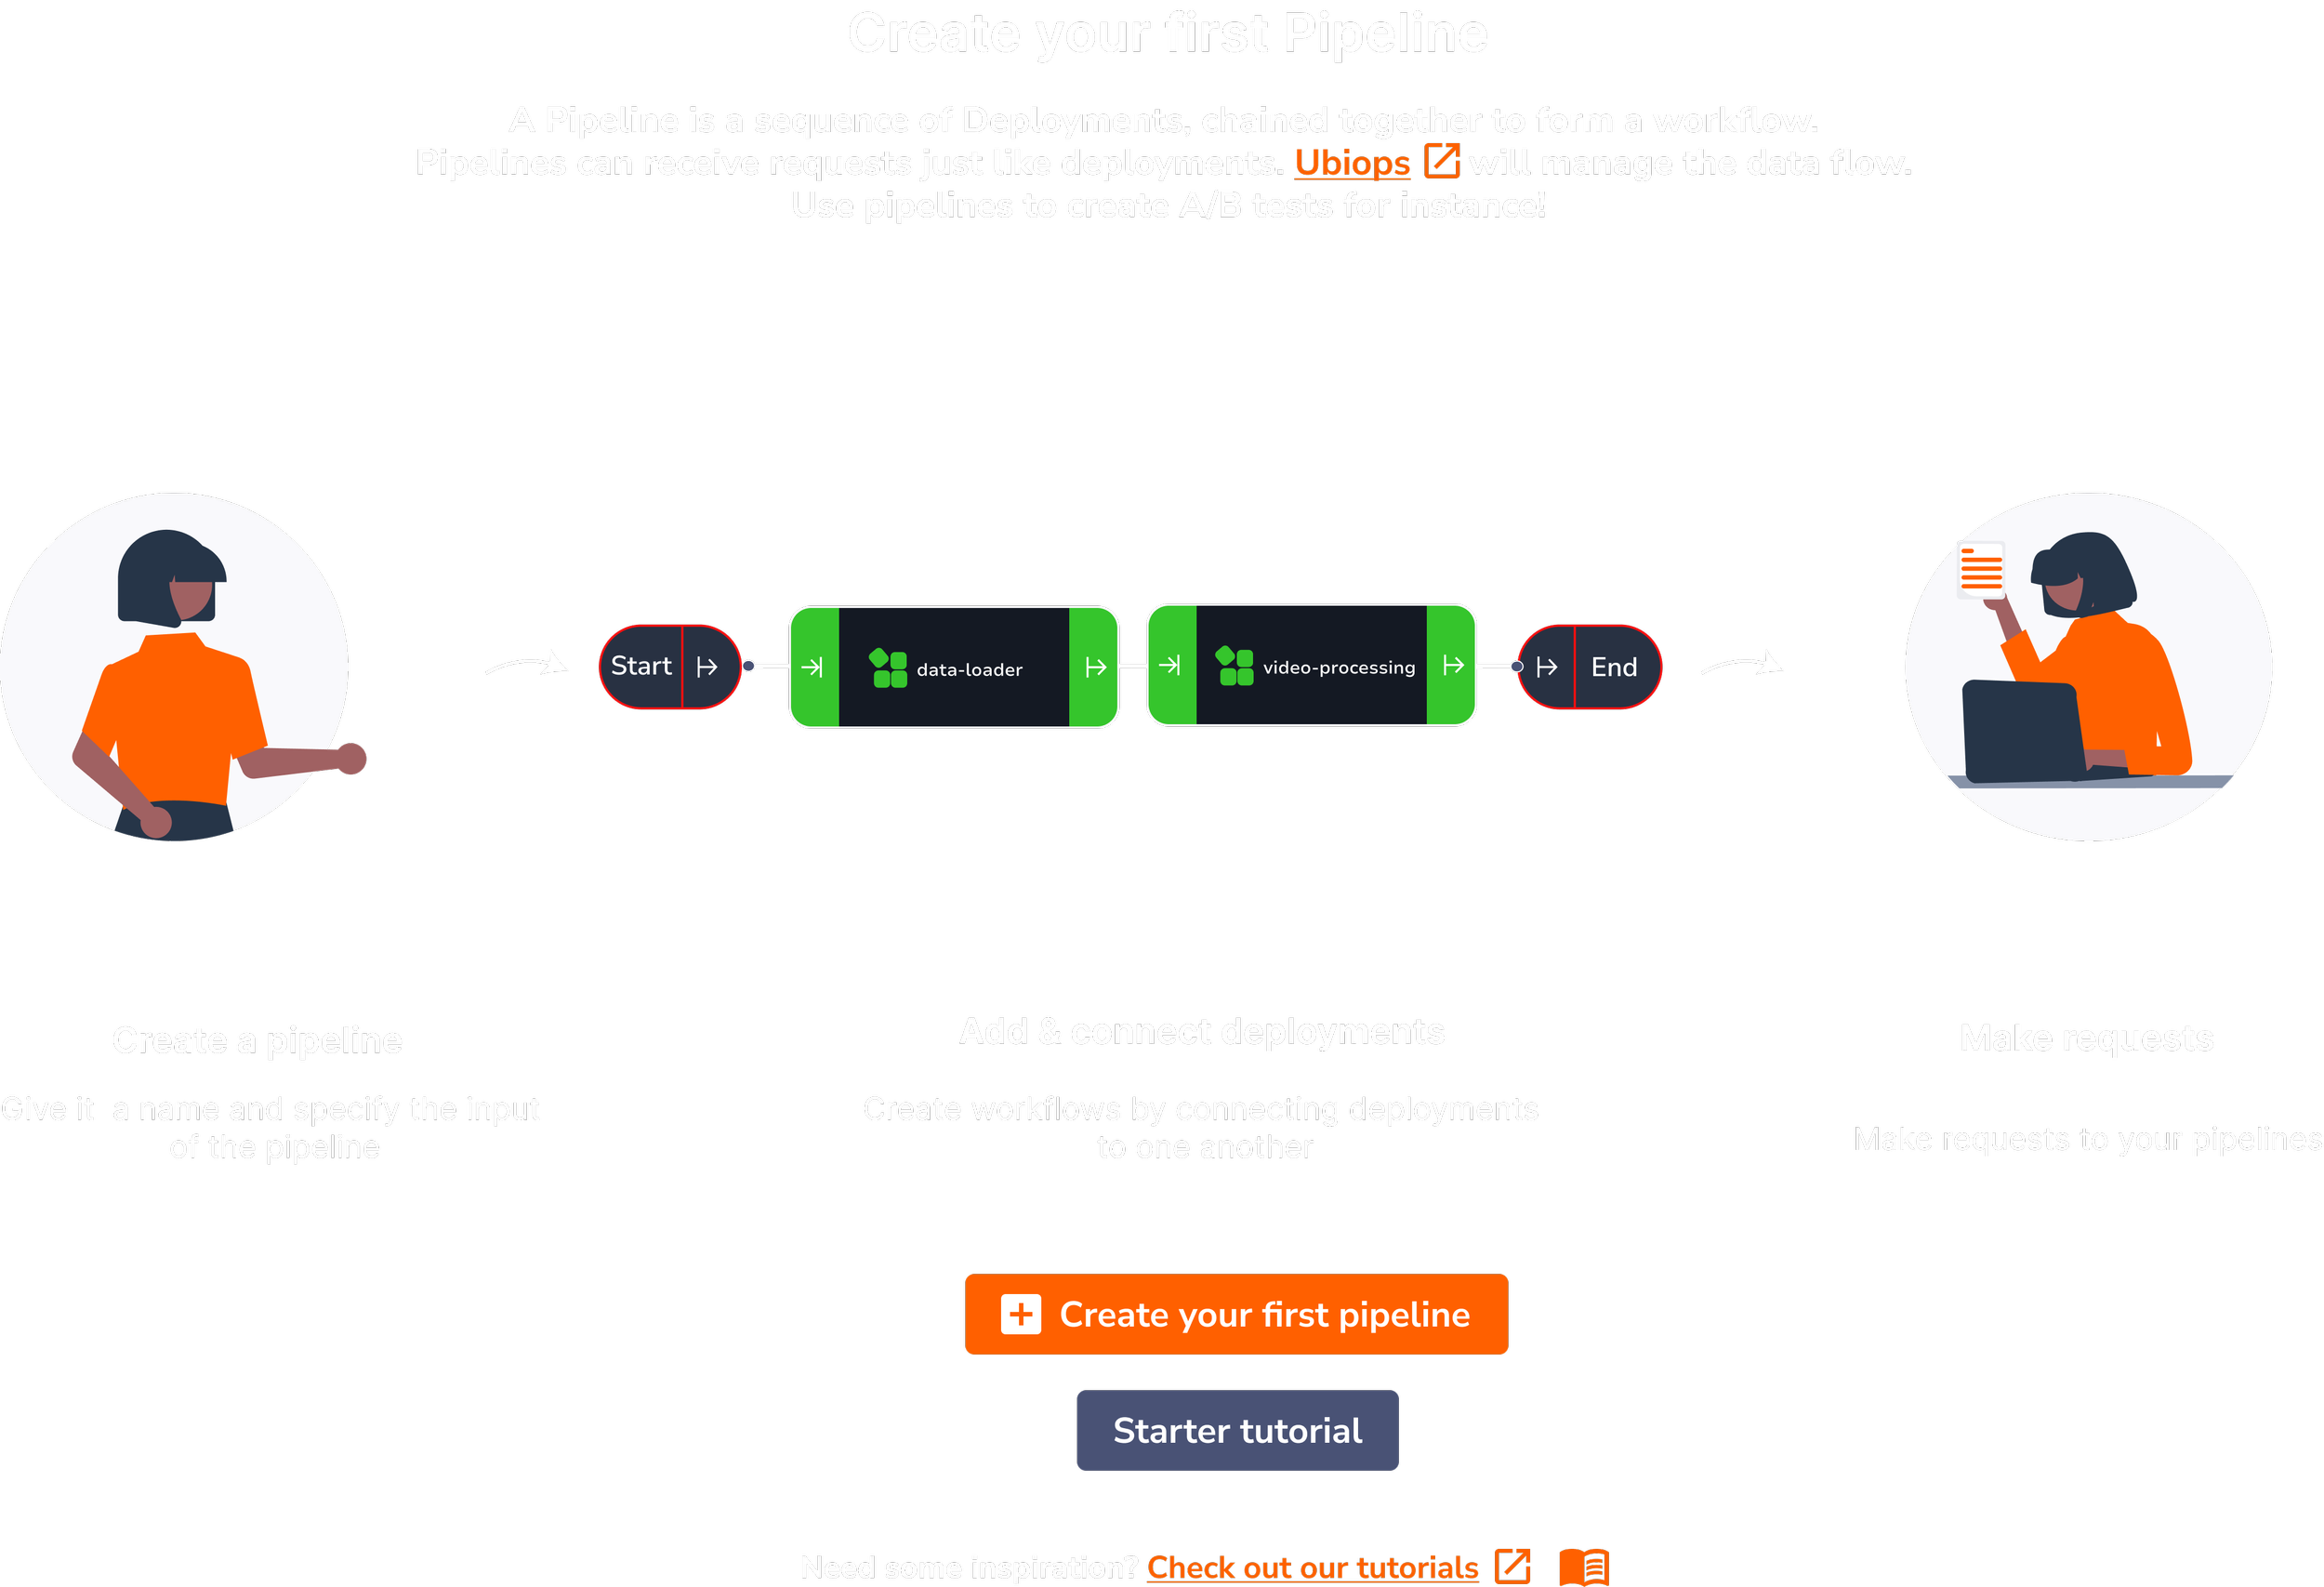
Users were able to build modular workflows by connecting deployments, via the Pipeline interface in the webapp - however this needed an upgrade both technically to include, operators, experiments and sub-pipelines and visually to improve usability.
ROLE
User Experience
Visual Design
Research
Wireframing
Usability Testing
Prototyping
TEAM
UX Researchers
Project Managers
Developers
DURATION
10 Months
The Challenge
The existing Pipelines interface was powerful but complex. Key challenges included:
Complex Connectivity
Users struggled to visually map and connect multiple modular components (deployments, operators, experiments, sub-pipelines) in a coherent workflow..
Designing Obscure Components
Designing components with a visual identity when the concept is obscure is a task in itself.
API Integration
Treating pipelines as deployments with their own API endpoints was a unique feature that needed clear representation without overwhelming users.
Scalability Transparency
Each component scales independently and has its own dependencies, yet this was not immediately evident in the UI.
Our redesign needed to simplify the creation and management of these modular workflows while preserving the advanced capabilities that our core users depended on.
The redesigned Pipeline interface delivered powerful results.
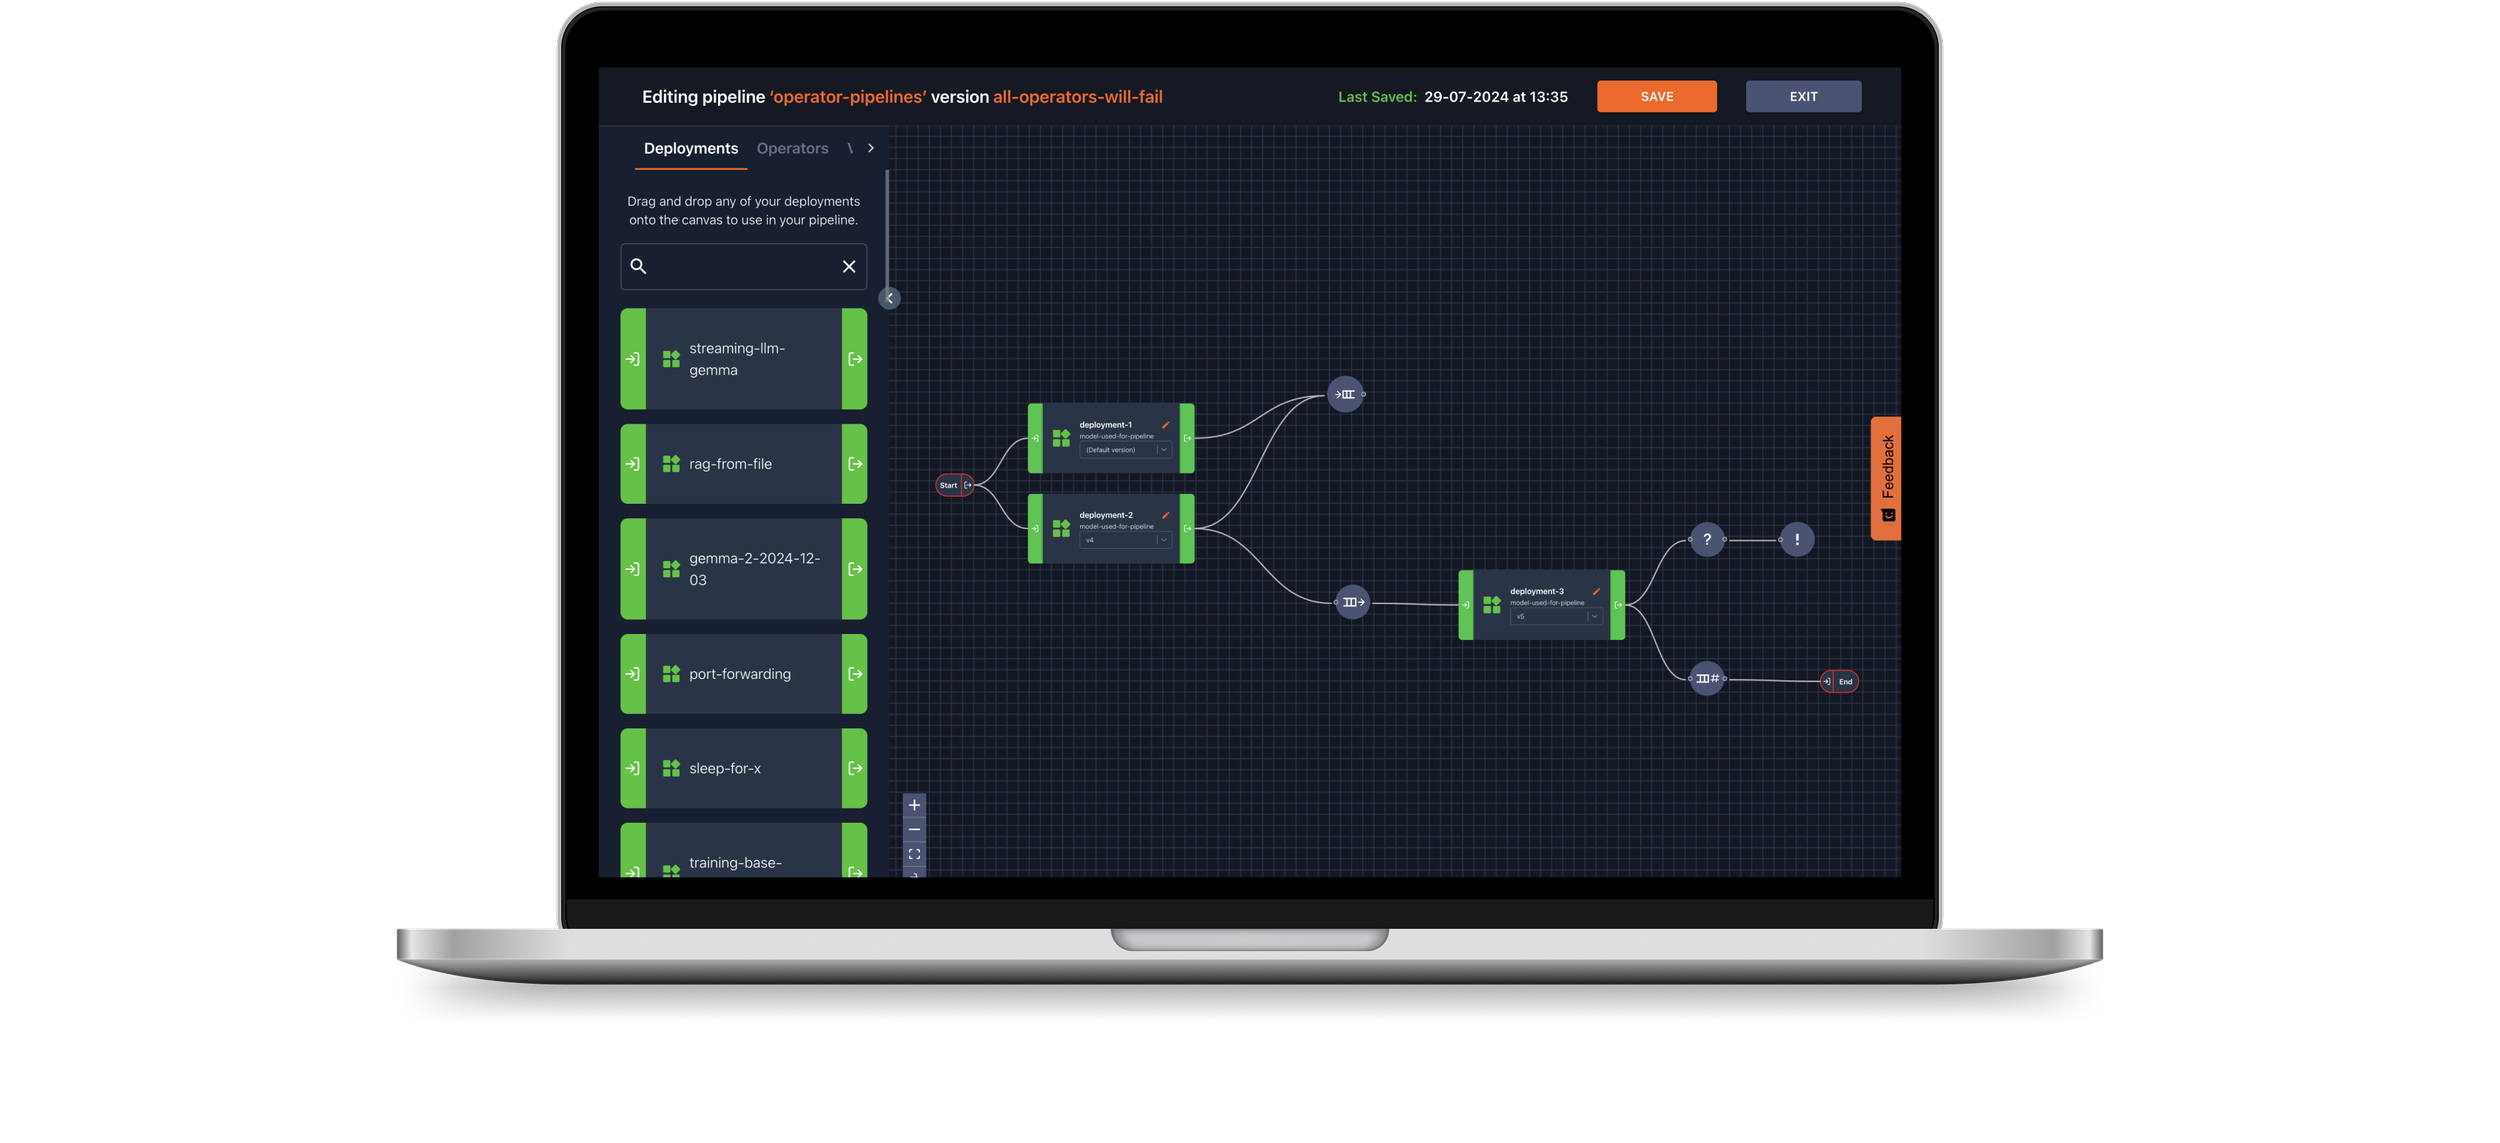
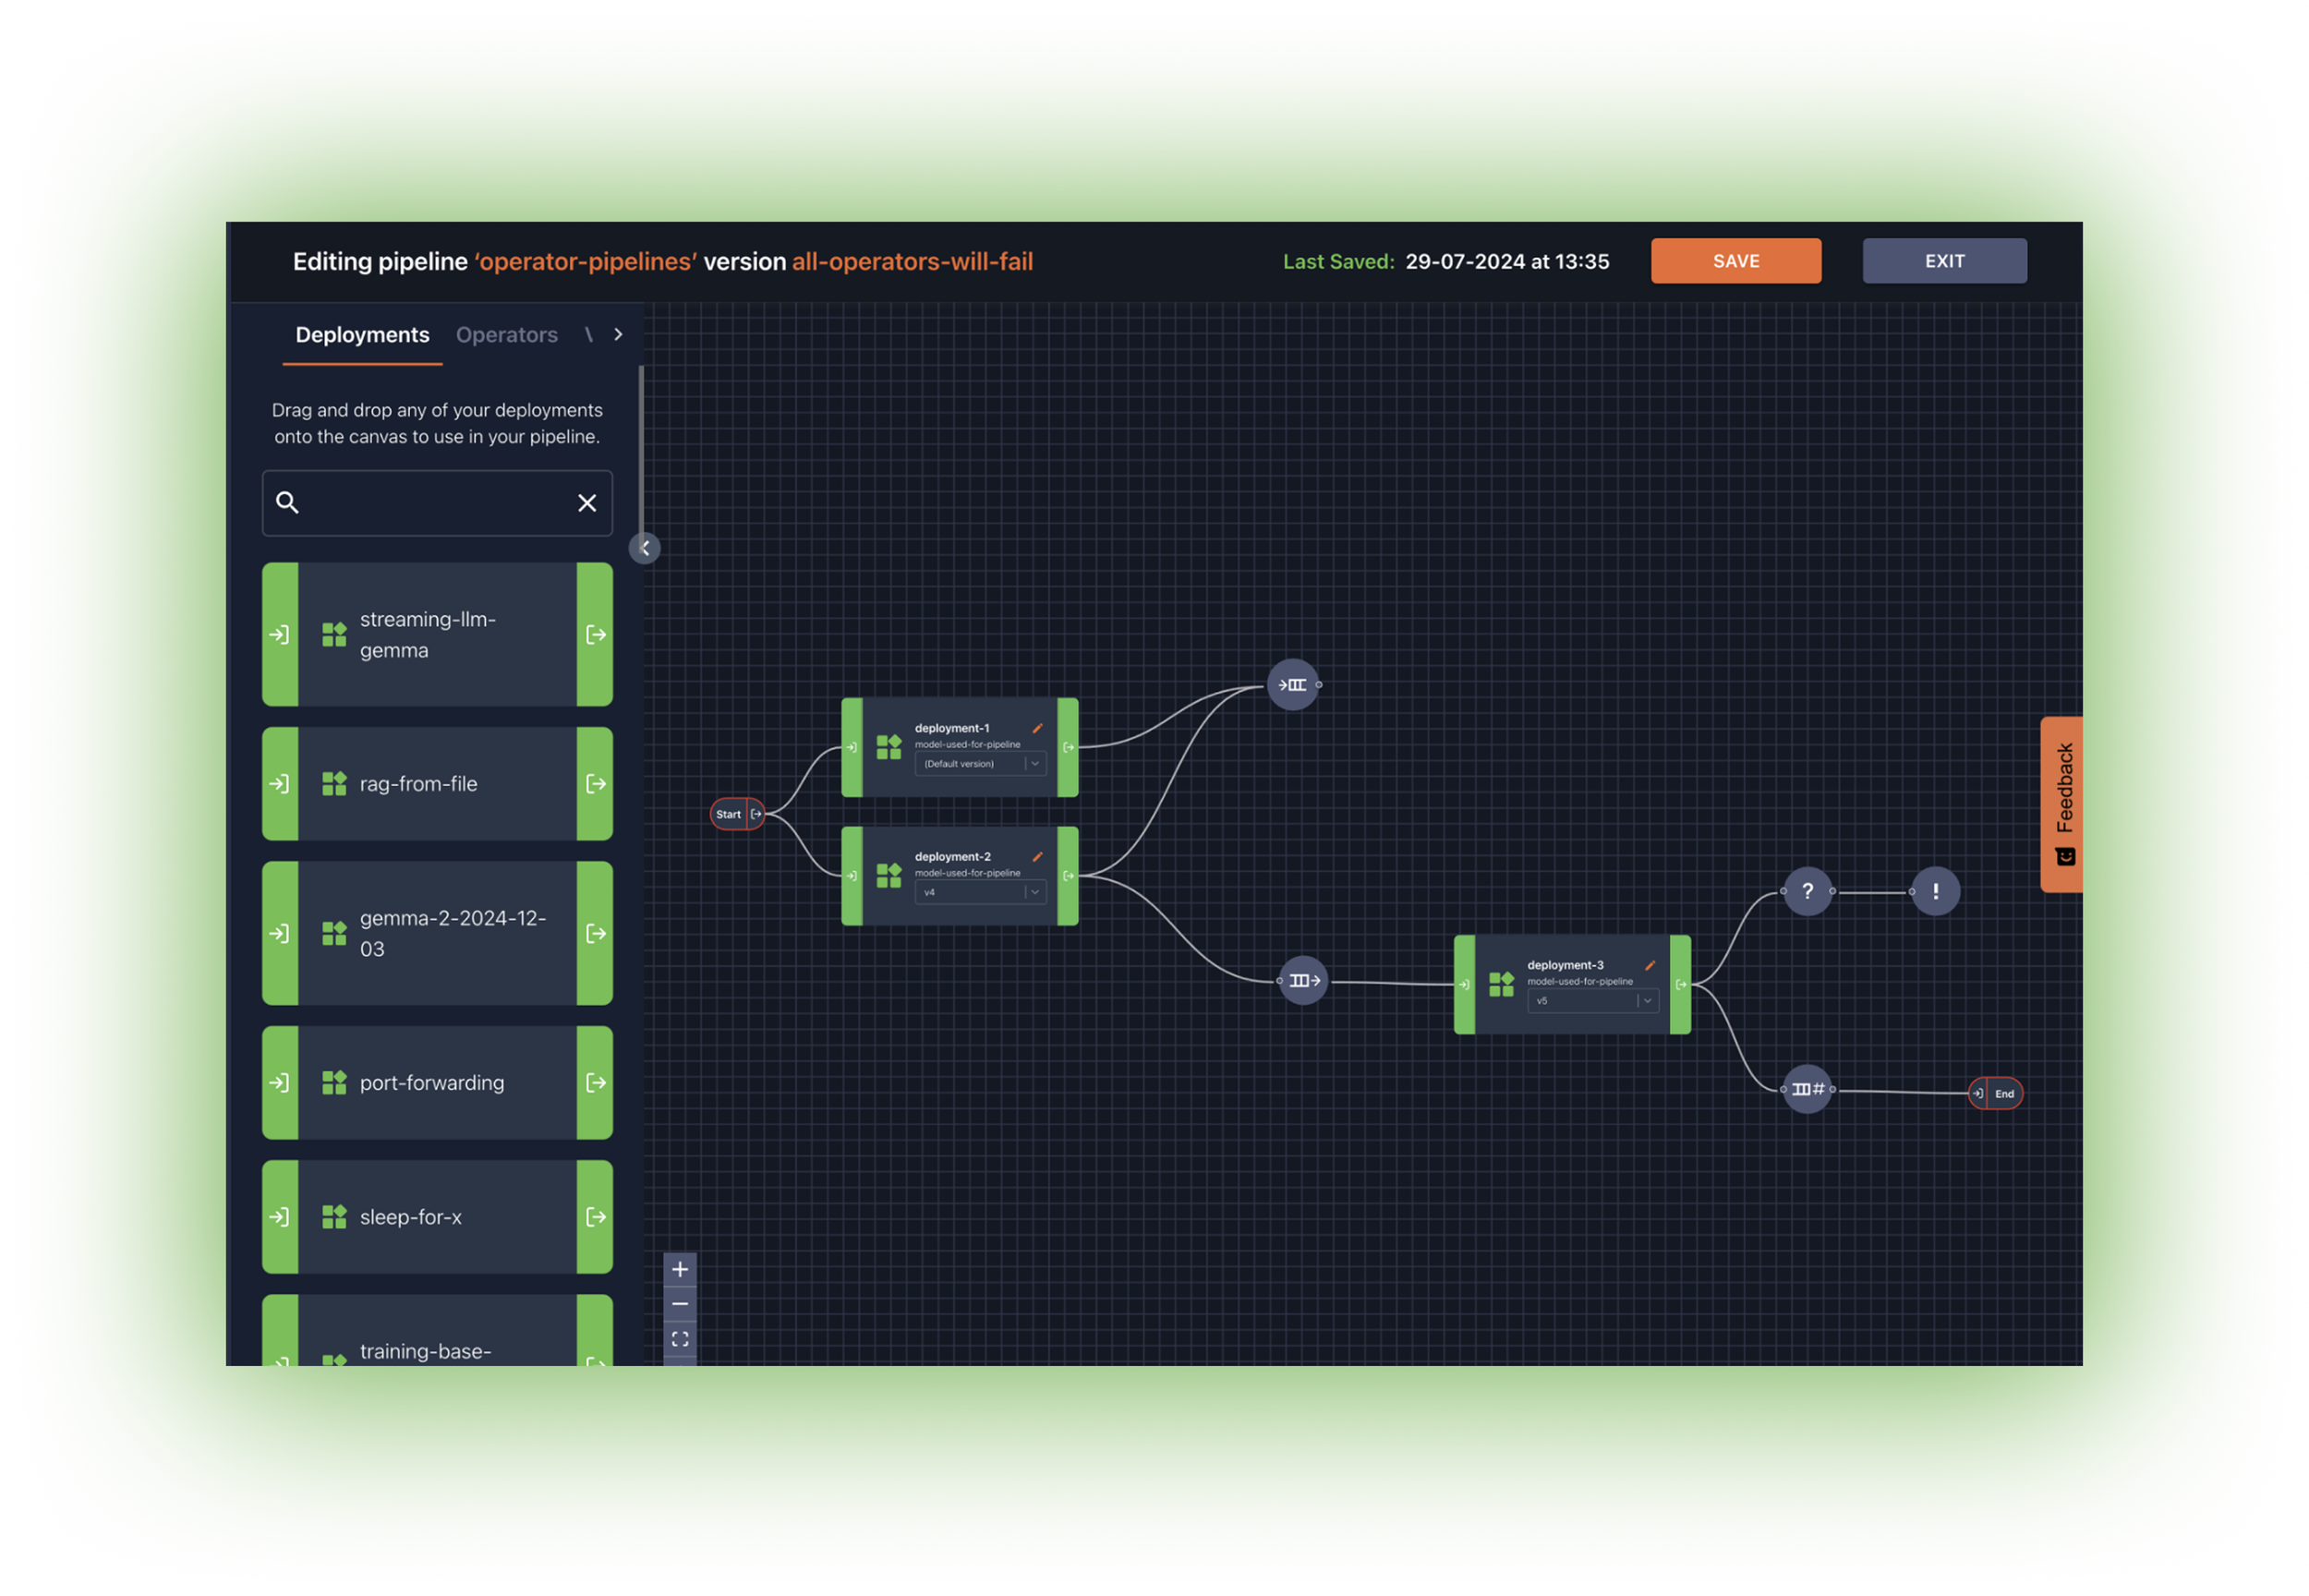
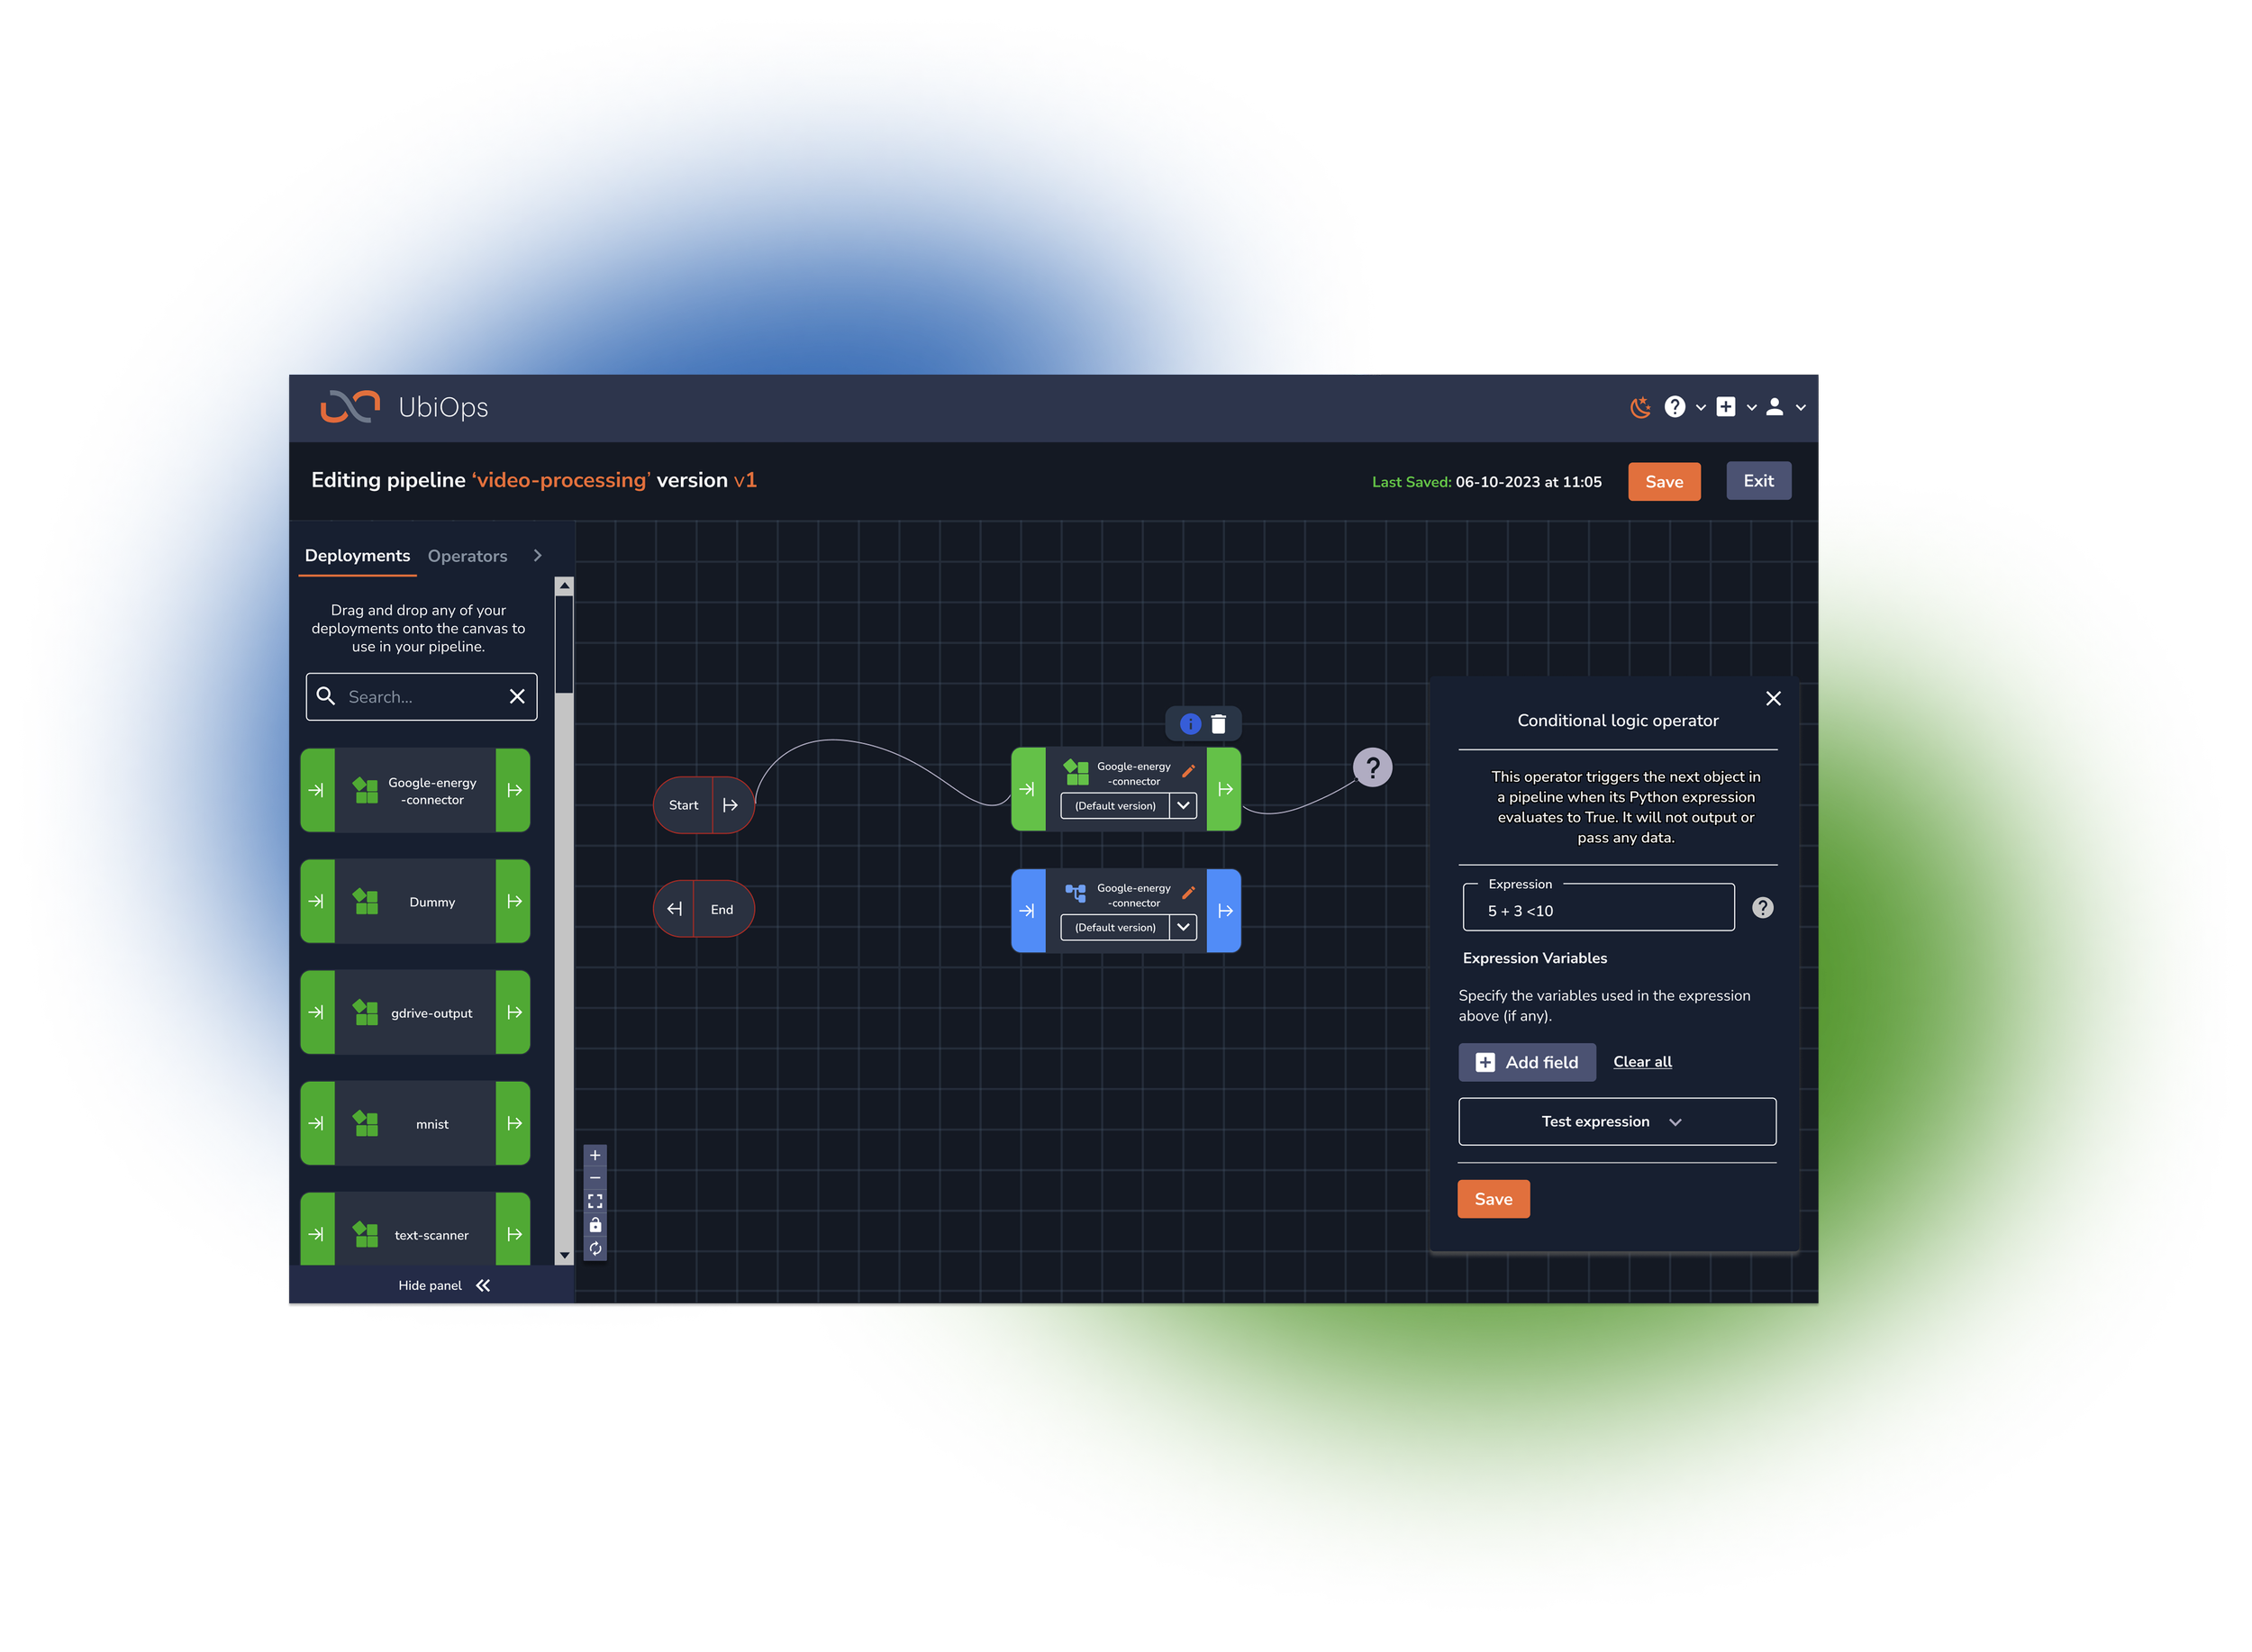
We moved from a cramped split-screen canvas to a sleek, full-screen experience. Users can now:
Drag deployments and connections directly onto the canvas
Add operators to pipelines with ease
Create variables seamlessly
Benefit from pipeline validation and an “on-error” policy that guides users at every step
The Impact has been dramatic
Average number of pipeline versions per organisation — up 6% year over year.
Total pipeline requests — skyrocketed from 181.2K to 1,821.9K, a massive 905% increase.
Average requests per project — jumped from 137.8 to 1,385.4, again a 905% boost after launch.
The new Pipeline editor hasn’t just improved the interface — it’s transformed the way teams work. Now, let’s dive into how we achieved this transformation.
Research & Insights
User Interviews & Observations
We interviewed 25 users, including data scientists, DevOps engineers, and ML engineers. Key insights were:
Visibility Of Workflow Structure - Users desired a clear, visual representation of how components connect and interact.
Ease of Reuse - They wanted an intuitive way to save, reuse, and update deployments and experiments across pipelines.
Scaling & Dependency Clarity - Users needed immediate visual cues to understand which components scaled independently and what dependencies they carried.
Seamless API Integration - It was crucial that pipelines’ API endpoints were easily discoverable and well-documented within the system.
Drag & Drop Canvas - Intuitive UI where users can build their Pipelines to visually map and explain complex Pipeline possibilities on one main screen.
Competitive Analysis
We reviewed comparable workflow and orchestration platforms.
Strengths - Some offered drag-and-drop interfaces and modular reuse.
Weaknesses - Many lacked clear visualisation for independent scaling and dependency management, which are critical for our user base.
Opportunity - A highly visual, intuitive pipeline editor that clearly demarcates independent modules and their interconnections could significantly enhance user productivity.
Design Process
Ideation & Information Architecture
We kicked off with collaborative workshops and card-sorting sessions with our users to:
Define Core Tasks - Identify critical tasks like connecting components, managing dependencies, and accessing API endpoints.
Map User Flows - Create workflows that clearly delineate how users create, update, and reuse pipeline components.
Understand Visual Hierarchy - Establish a visual hierarchy that differentiates between primary workflows and reusable modules.
Mid-Fidelity Wireframes
I first sketched basic layouts highlighting a drag-and-drop canvas that let users intuitively connect components. These sketches were then turned into mid-fidelity wireframes, allowing quick feedback from designers and team members. The goal was to iterate rapidly without getting bogged down in details.
Personas
Based on our research, we developed three primary personas:
Kees, Data Scientist - Wants to be able to create complex data processing workflows using reusable experiments to easily modify pipelines without breaking dependencies. He often gets frustrated by confusing visual layouts and obscure component dependencies. He often has difficulty trcking reused components across different pipelines.
Wouter, DevOps Engineer- His role is to ensure the smooth deployment and scaling of individual components. It’s important to be able to monitor and adjust independent parameters effectively. He struggles to manage API endpoints for each pipeline, limited visibility into how each module scales and it’s environmental dependancies hinders his workflow.
Mannon, ML Engineer - She needs to rapidly iterate on experiments and integrate them into live pipelines. Successful components should be reusable across multiple projects. She’s often overwhelmed by the complexity of connecting and reusing components.
High-Fidelity Prototypes
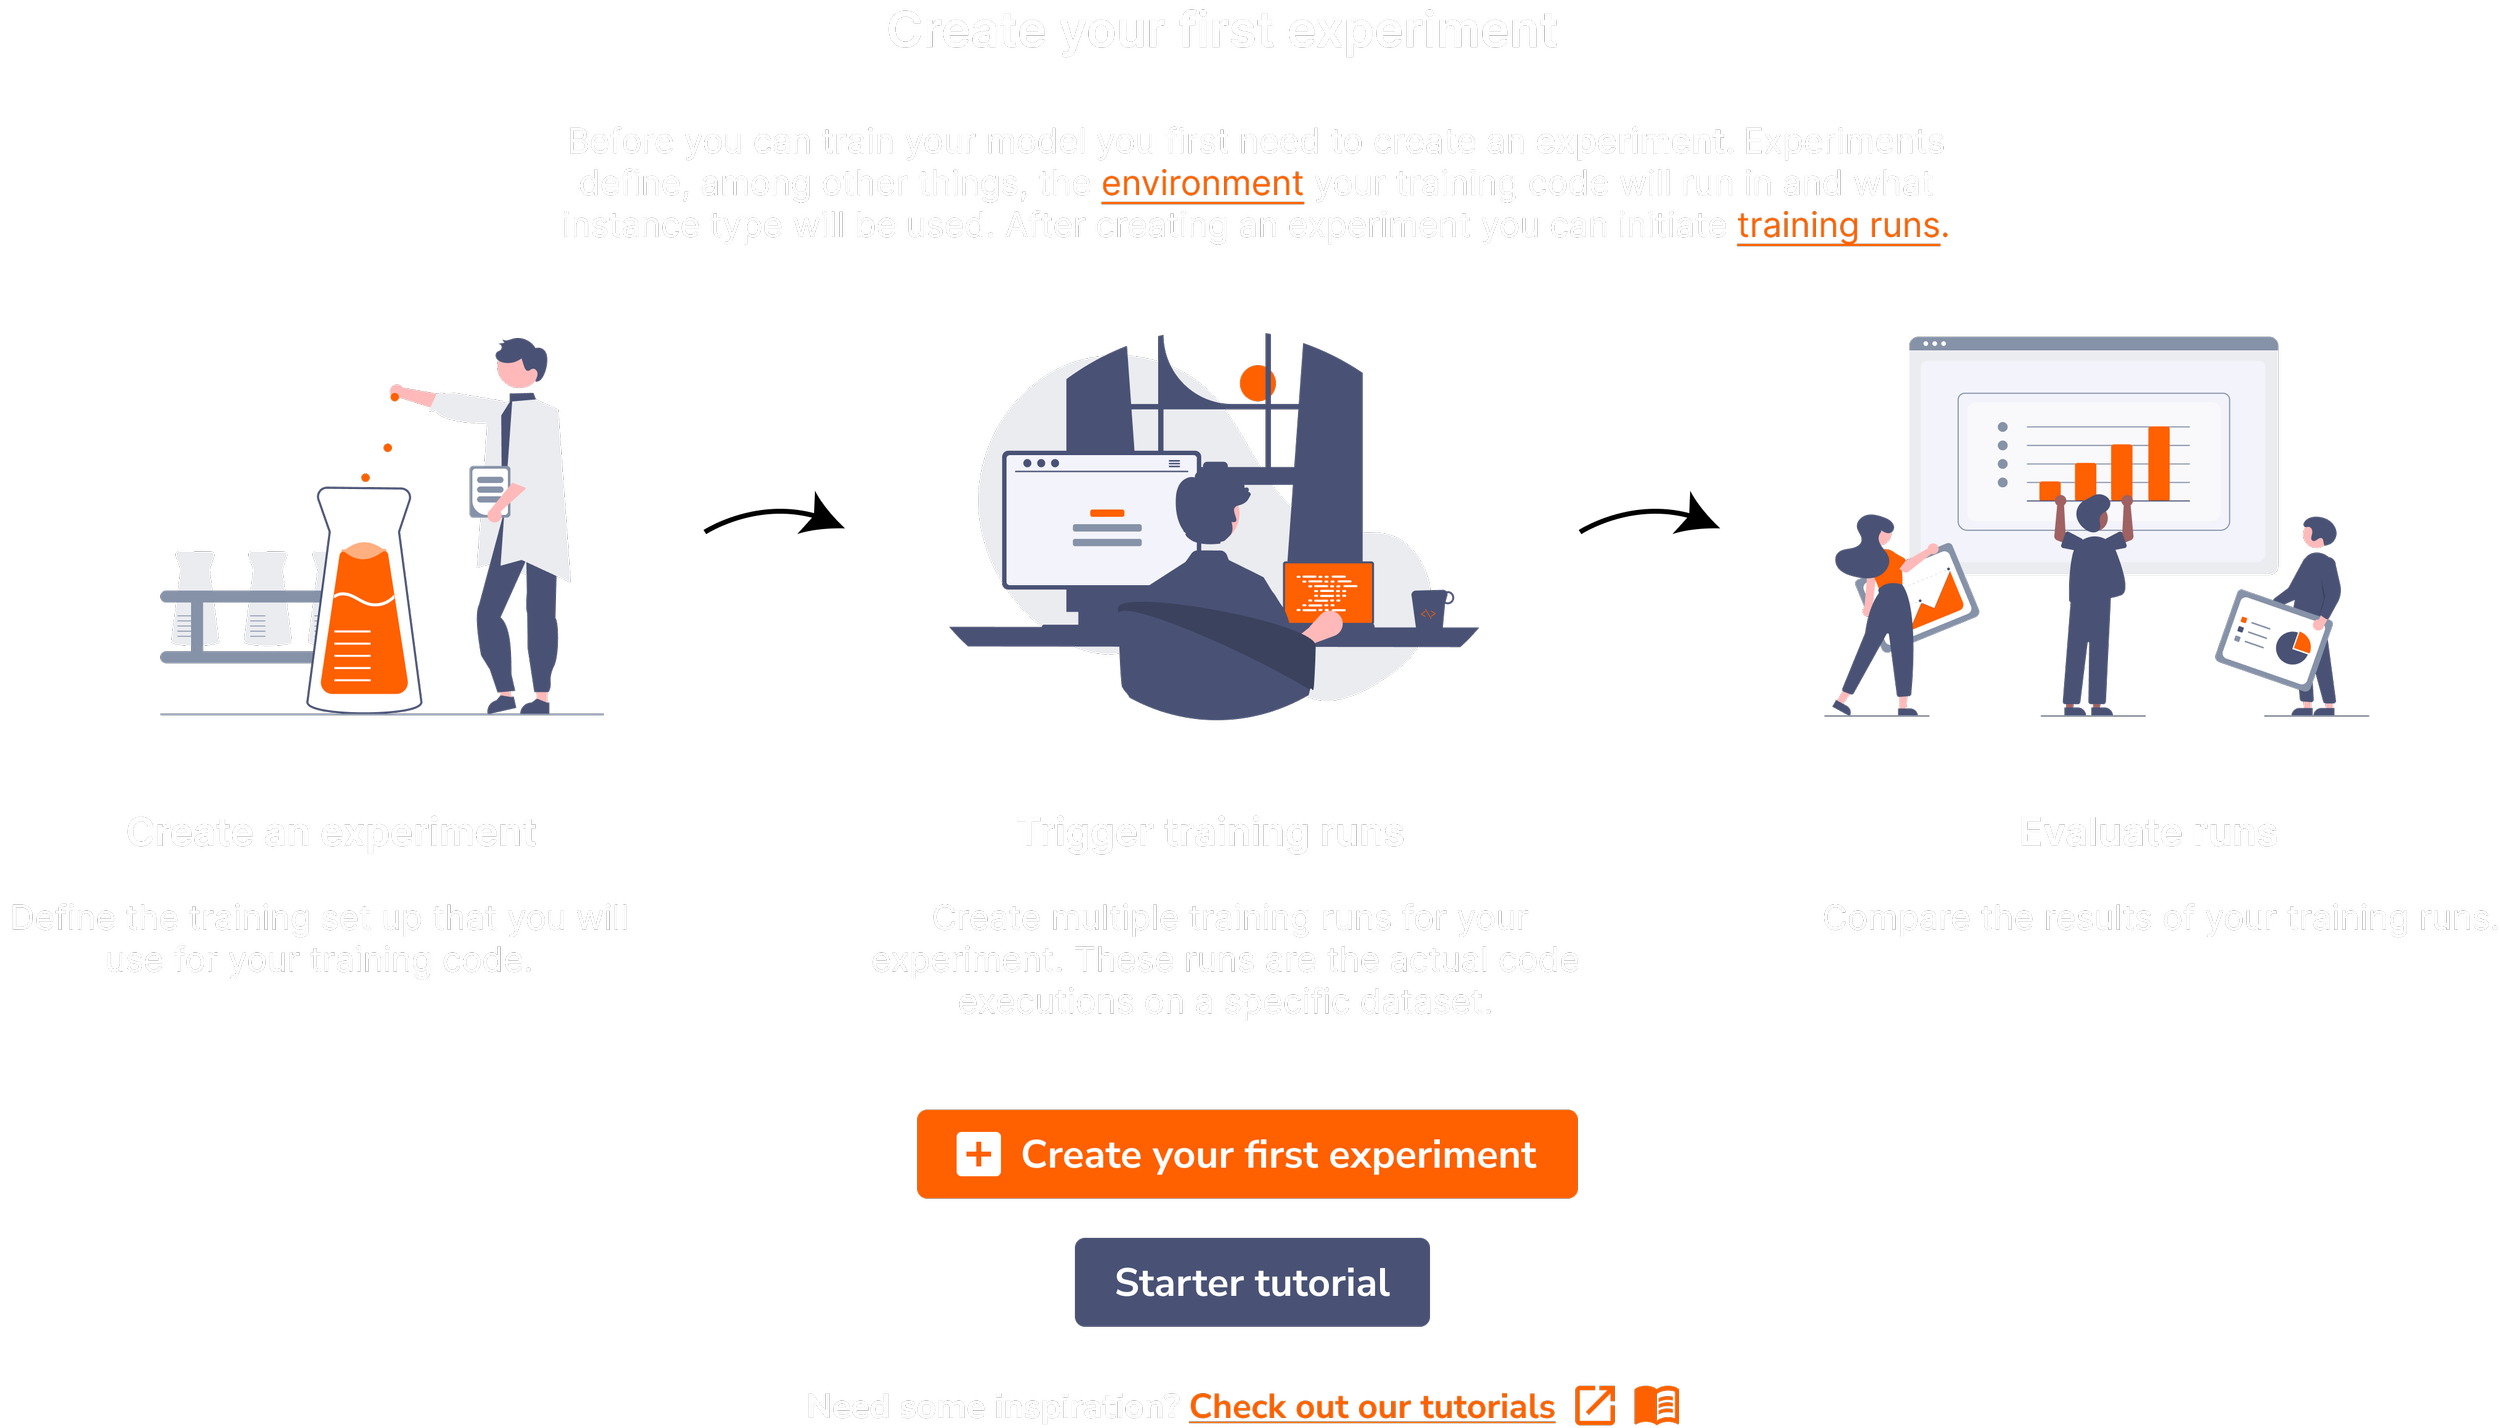
Developed interactive prototypes with a modular editor, allowing users to drag, drop and connect modules. Visual cues such as colour-coded lines and icons were added to indicate scaling, dependancies and reusable components. Clearly visible API endpoint information and documentation links for more complex ideas were embedded into the pipeline interface for quick access to information.
Usability Testing
We conducted multiple rounds of usability testing with our key personas.
Visual Mapping - Testers found the new drag-and-drop interface significantly easier for mapping workflows.
Reusability - Users appreciated the ability to save and reuse components, though we refined the labelling and versioning system based on feedback.
Scalability Information - Visual indicators for independent scaling and dependencies were well-received, but we iterated on tooltip content to improve clarity.
API Integration - The direct integration of API endpoint details was praised for reducing context switching.
Infographics- Communicated core ideas effectively to users and provided additional technical information at key moments in the Pipeline UI.
Final Design
Key Features
Modular Workflow Editor
A drag & drop canvas for assembling pipelines with a snap to grid functionality and smart connectors to enforce logical workflows.
Reusable Components Library
Save, version and reuse modules across pipelines. Clear visual markers to indicate when a component is used multiple times.
Independent Scaling & Dependancy
Colour-coded links and tooltips signal independent scaling and dependency chains. Interactive overlays that display detailed dependency information on hover and tap.
Pipeline API Endpoint Integration
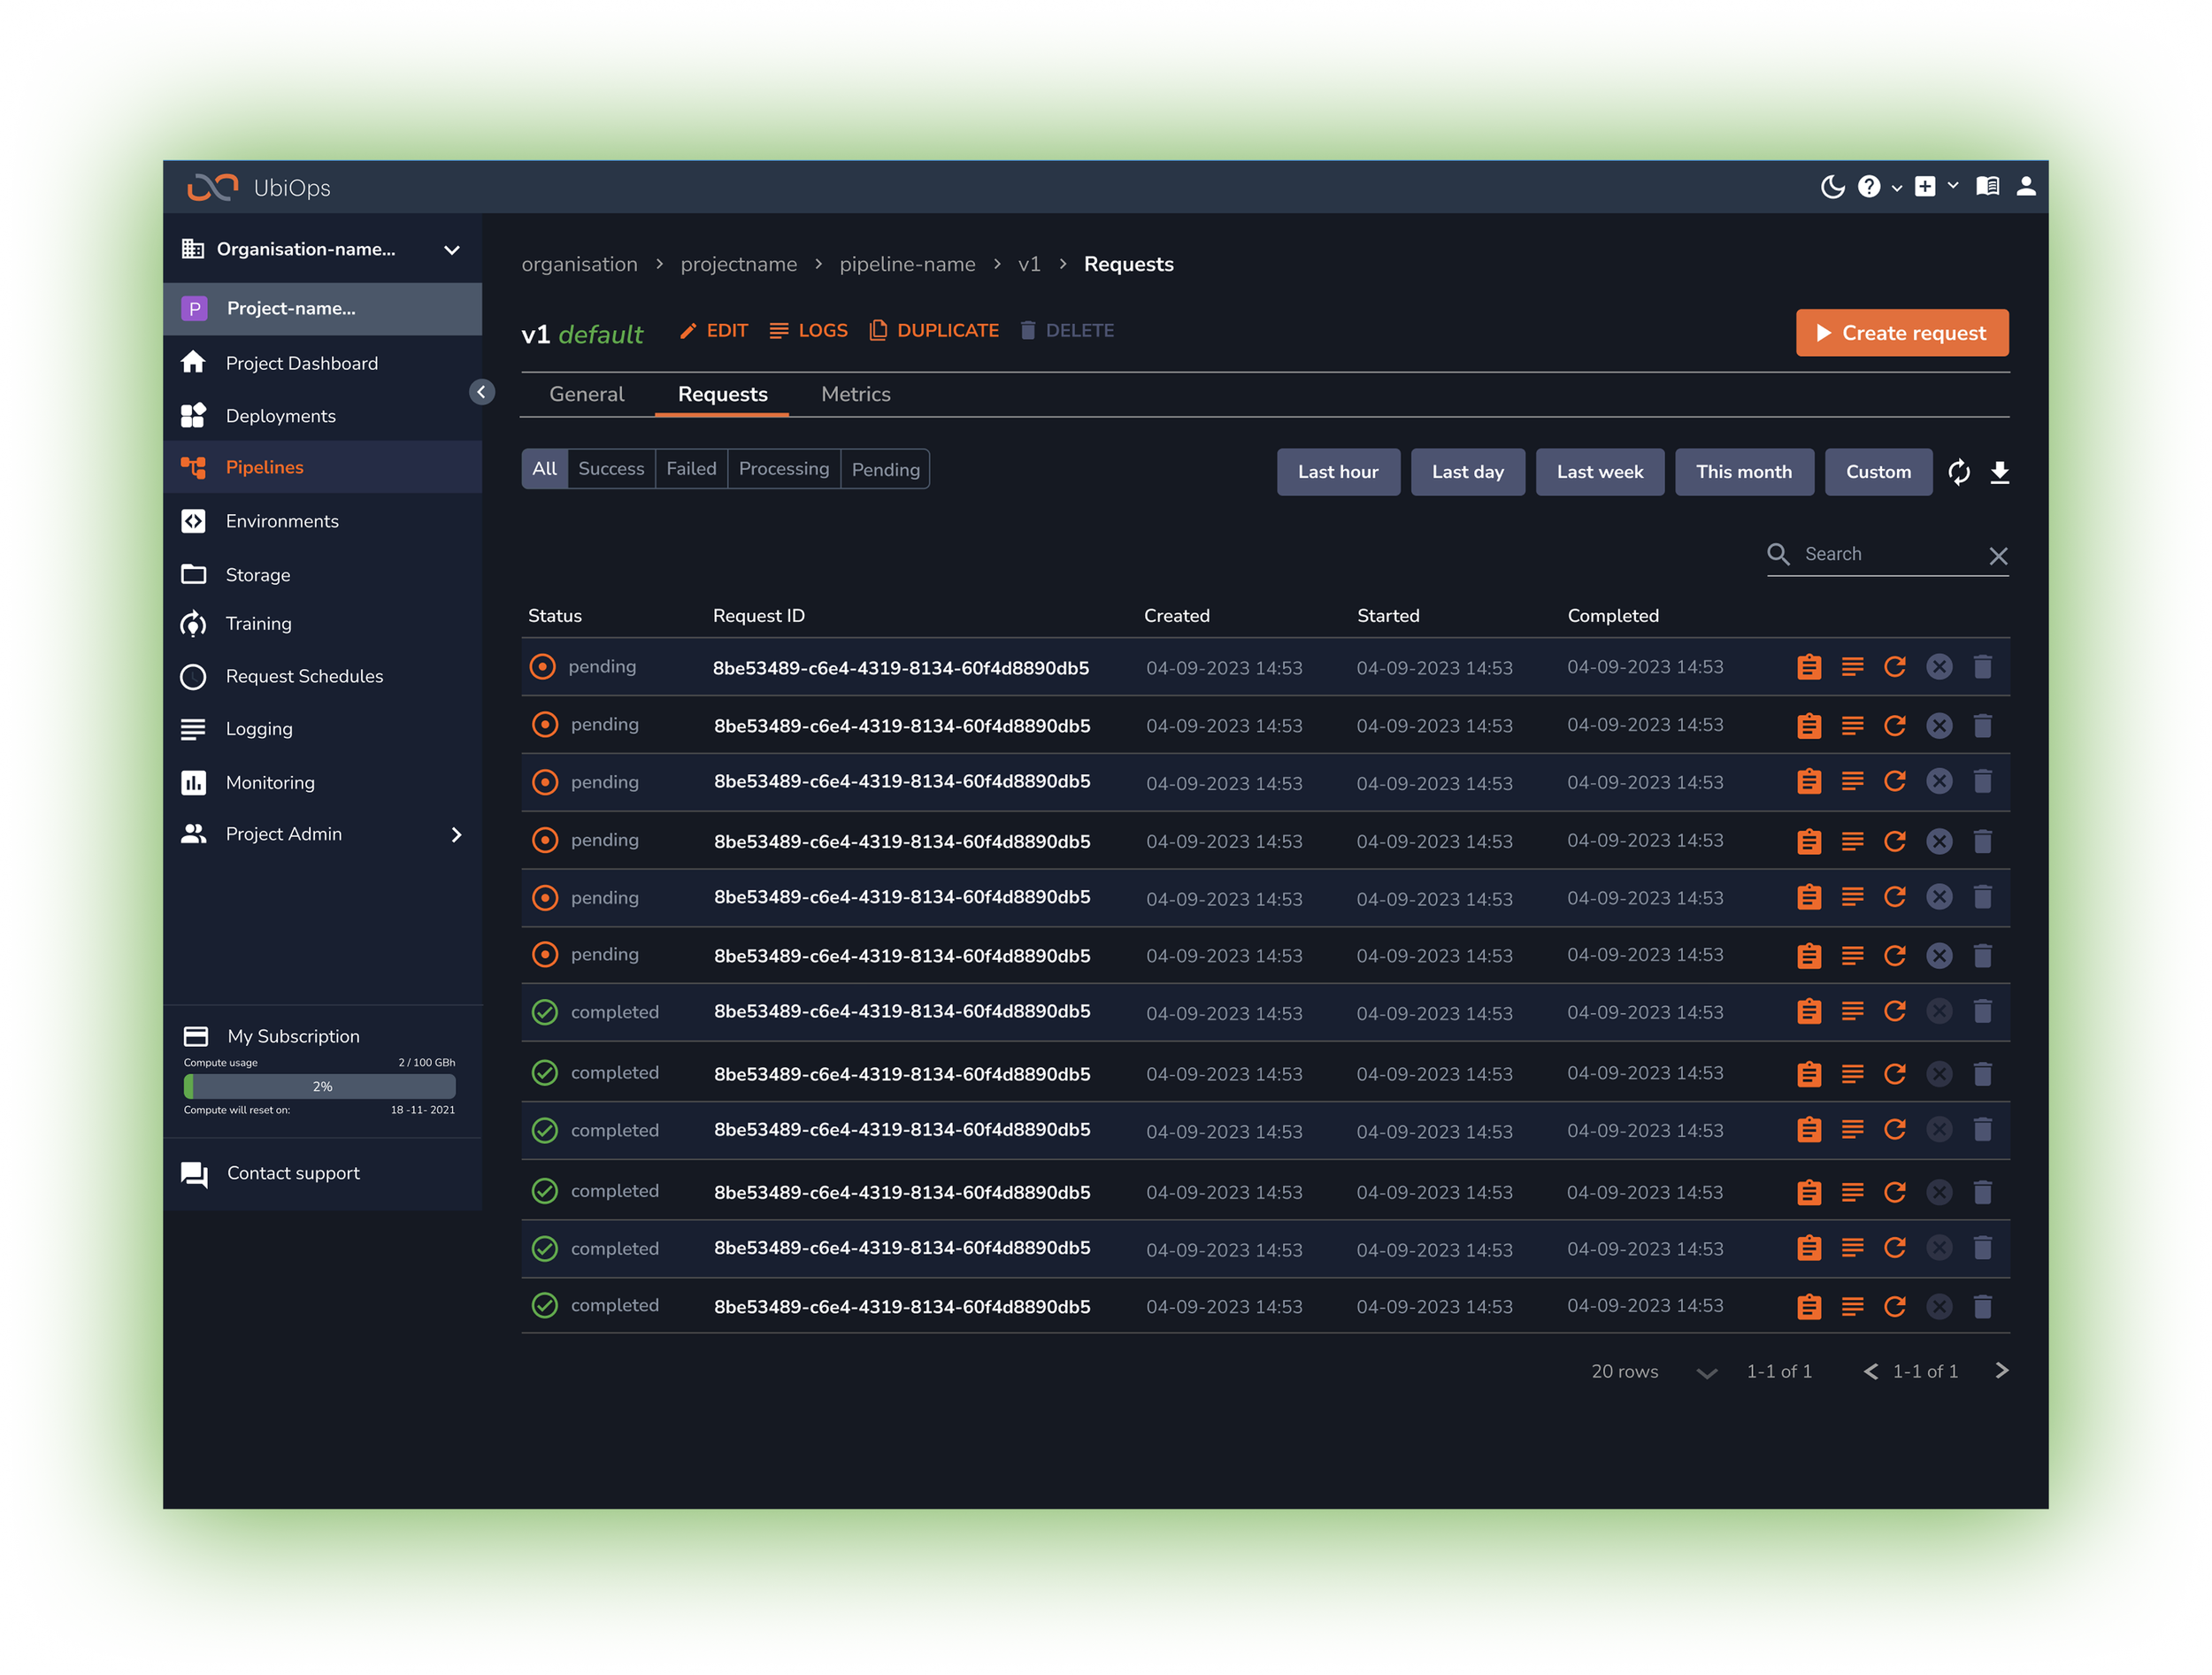
Each pipeline displays its own API endpoint in a dedicated overview. Built-in documentation allows for detailed in depth overviews to help create functional deployment workflows.
Sub-Pipeline Support
Ability to nest sub-pipelines, enabling hierarchal workflows that remain modular and easy to manage.
Visual & Interaction Design
Aesthetic - A clean, modern interface with a focus on clarity and ease of use. Consistent iconography and colour schemes to differentiate the types of components in line with the UbiOps brand.
Interaction Patterns - Responsive drag and drop interactions with smooth animations. real-time feedback on component placement, connectivity and dependency validation.
Accessibility - High contrast visuals to ensure the UI is usable for all technical users. Keyboard navigational controls to be considered.
Impact & Learnings
Key Takeways
Modularity Drives Agility
Empowering users with reusable components and clear visual cues can drastically improve workflow design and deployment speed.
Interactive testing Is Crucial
Continuous user feedback was essential in refining both the visual design and functional interactions.
Balancing Power & Simplicity
The challenge was to retain the system’s advanced capabilities while making it accessible and intuitive for a diverse user base.
The Results
Client Feedback
“ UbiOps allowed me to reduce a 4 hour process to 15 minutes thanks to its intuitive pipeline construction interface and parallelization methods.”
Emersio
Outcomes
Stats & Feedback
